Link to Part 1: Assembling an Intel-Powered Lab
Disclaimer: This is not production guidance and it is not sponsored. It documents what actually ran in my homelab with Arc GPUs and k3s, so please double check before you roll it into your own setup.
Table of Contents Link to heading
- Table of Contents
- 00 Philosophy: Get to Kubernetes fast and dirty, because I want to run some damned AI finally!
- 01 Day 0: k3s no bs
- 02 Software updates
- 03 Storage layout
- 04 Intel GPU support: the bare minimum
- 05 TLS: a local CA for now
- 06 Secrets: SOPS, encrypted in Git
- 07 Architecture diagram
- 08 Component overview
- 09 To-do and next steps
In the first part of this series, I walked through the hardware choices and the initial setup of my Intel-powered homelab. With the machines successfully doing their best to keep optimal temps this summer, it was time to document the first big step - building up the cluster.
Some personal notes follow below, if you want to skip them, just scroll down to the next section or up to the table of contents to get to wherever you want to go.
00 Philosophy: Get to Kubernetes fast and dirty, because I want to run some damned AI finally! Link to heading
Not too dirty though…
In previous homelab builds I spent weeks on setting up complex home networks, PXE booting, HA experiments with external datastores, etc. An important lesson is that your project needs to have a priority and learning goal, otherwise you can get lost in making the most balanced, perfect, and future-proof setup. So forgive the ignored best practices of some aspects of this setup. The focus is of course running AI workloads on Intel Arc GPUs, For now, I avoided using an ephemeral cluster I bring up and destroy locally, like kind but that may change. So this is a mix of both worlds, not a perfect 3-master HA cluster with all the bells and whistles, but also not cluster running locally.
Flux and GitOps Link to heading
I’ve used helmfile with a pipeline setup in Gitlab for my previous homelab and use ArgoCD at work. Flux is a bit different but I like it for its pure GitOps approach. I’m a bit tired of clicking, to be honest. I don’t want to click around in a UI, or follow pipelines along. I want to commit like a mad man and after a while have my changes propagated to the cluster. In theory, ArgoCD can do that too but there’s something about the way you write the argo manifests that doesn’t feel as clean as Flux. Don’t treat this as a valid technical argument, it’s just a personal preference. I also had a fun talk with a colleague once about the differences and this was his take:
I’ve been working in 3 companies in a row, first one was using helmfile, second - argo, and third - flux And in the first one we were just getting things done with k8s and having fun with other tasks, like we were working on an open source project, or trying complicated setups and different tools. But in the rest we were mostly trying to make GitOps work, re-writing manifests because of YAML typos, reviewing something like 700 lines of YAML code, merging, fixing, and trying to make GitOps work again.
Hopefully this cluster won’t grow to the extent that I have to deal with that :)
But yeah, the biggest time waster was following the logs of the Flux helm controller, trying to figure out why it didn’t apply the changes I made, redoing the changes, manually reconciling, etc. Dealing with all the different ways the helm charts of the tools organize their values is one of the reasons I’m becoming skeptical of helm recently. Also, using the Flux configMap and secret generators and integrating them with SOPS was a bit of a pain. However, when all the pieces fell into place and made a sound template, it was just a matter of replicating the same pattern for the rest of the cluster components.
01 Day 0: k3s no bs Link to heading
I stripped k3s of the pieces I’d replace anyway — flannel, kube‑proxy, traefik. I love cilium because of its alien eBPF magic I don’t quite understand, the visibility and the node firewall rules it gives me so that’s the CNI, end of story. Everything was run manually with a set of simple scripts. This is one of those compromises I mentioned earlier.
Control Plane:
curl -sfL https://get.k3s.io | sh -s - server \
  --token {token} \
  --cluster-init \
  --flannel-backend=none \
  --disable-kube-proxy \
  --disable servicelb \
  --disable-network-policy \
  --disable traefik \
  --tls-san=sondas \
  --tls-san=sonda-01 \
  --tls-san=sonda-02 \
  --tls-san=sonda-core \
  --tls-san=127.0.0.1 \
  --kube-apiserver-arg=kubelet-preferred-address-types=InternalIP,ExternalIP,Hostname
Workers joined with:
curl -sfL https://get.k3s.io | sh -s - agent \
  --token {token} \
  --server https://sonda-01:6443
I kept both the NUC and the GPU box as workers and only later differentiated them with taints.
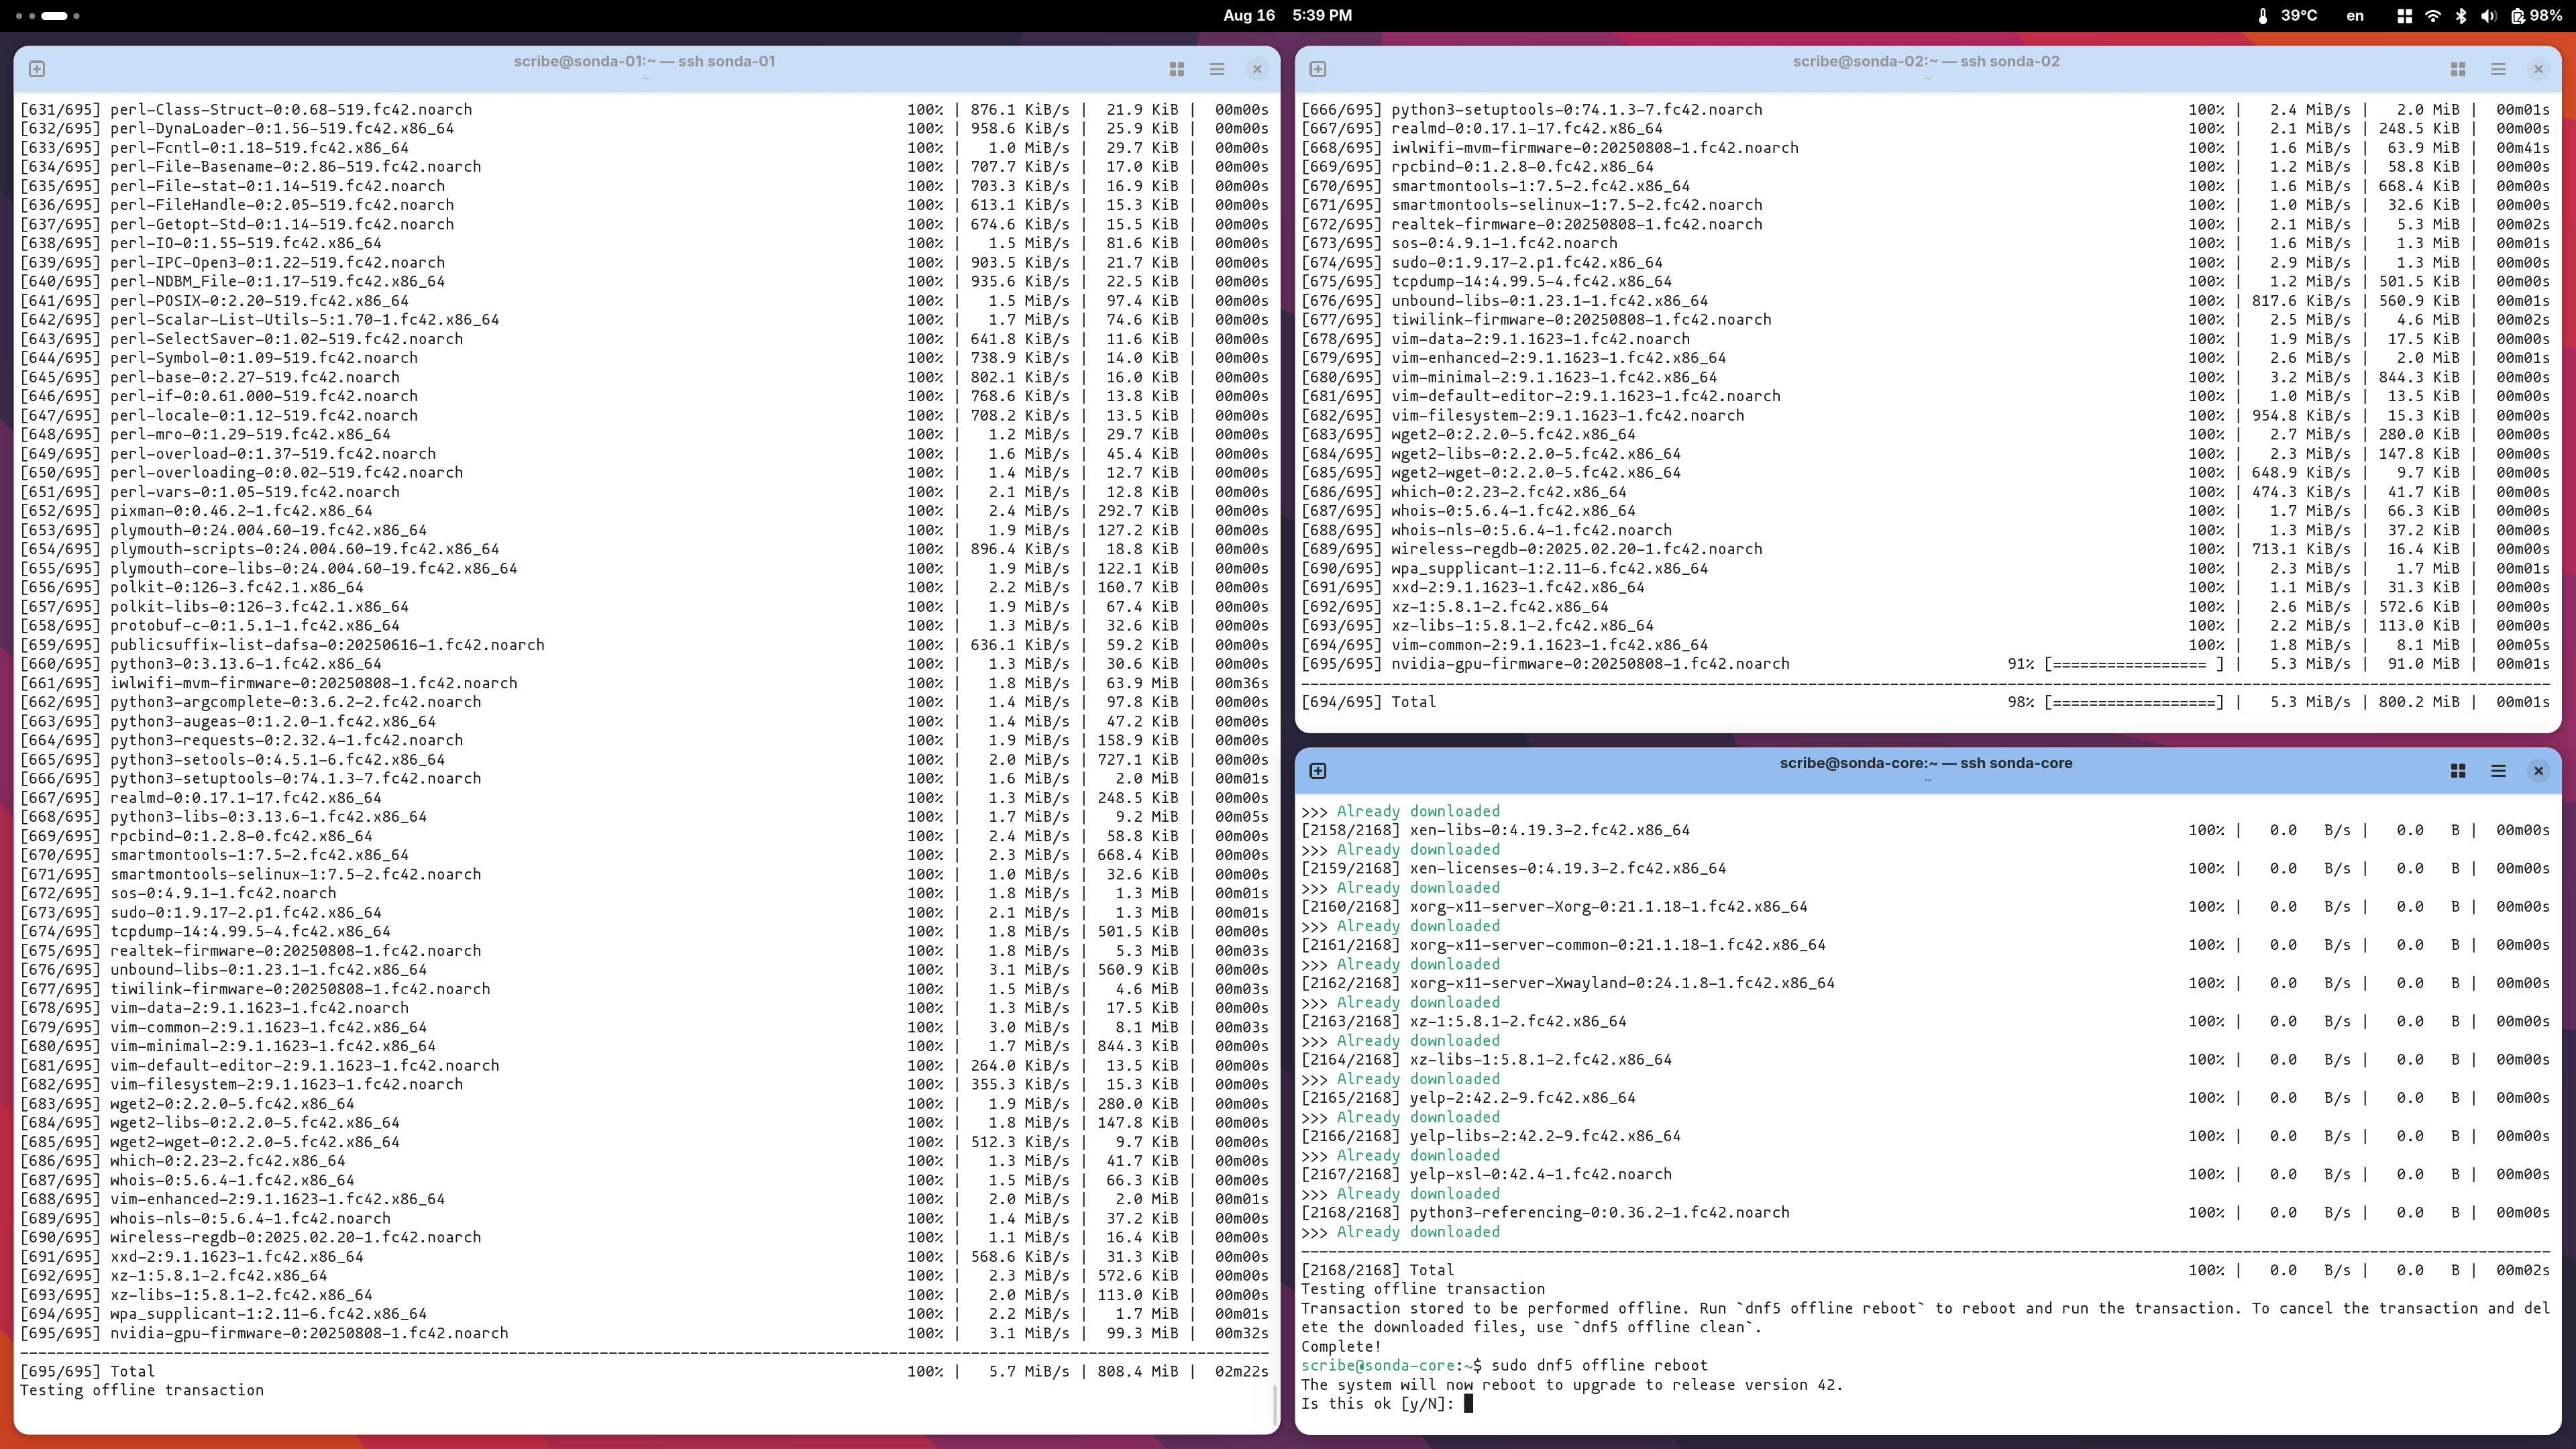
02 Software updates Link to heading
Disclaimer: No automation regarding OS package installation or upgrading.
- Host packages and kernel updates are just a manual
dnf upgradeabout once a month too - as well as OS upgrades, whenever a new Fedora Release comes out.
03 Storage layout Link to heading
- NUC nodes: single 512 GB disk given entirely to k3s.
- GPU node: 2 TB NVMe for k3s data, 512 GB for the OS, and a separate 2 TB scratch disk for local experiments.
04 Intel GPU support: the bare minimum Link to heading
On the GPU node only I enabled Intel’s oneAPI repo and installed the base bits so containers would see Level Zero and friends. The operator doesn’t install drivers; hosts must be ready beforehand.
# Enable Intel oneAPI repo and install base packages
sudo tee /etc/yum.repos.d/oneAPI.repo >/dev/null <<'EOF'
[oneAPI]
name=Intel oneAPI repository
baseurl=https://yum.repos.intel.com/oneapi
enabled=1
gpgcheck=1
repo_gpgcheck=1
gpgkey=https://yum.repos.intel.com/intel-gpg-keys/GPG-PUB-KEY-INTEL-SW-PRODUCTS.PUB
EOF
sudo dnf -y install intel-basekit intel-oneapi-runtime-libs
Installing the intel-basekit, intel-level-zero and the SYCL packages will result in a system that supports the Intel Arc GPUs and the Level Zero API.
This support is later extended in Kubernetes with the intel-device-operator and intel-device-plugins-gpu to expose the GPUs to the cluster, which you can follow in the next section at Intel GPU specifics on k8s level.
- Sanity Test: To make sure everything is working at this stage, I usually go through the process of pulling an ipex image, which stands for intel-extension-for-pytorch.
You can run a simple sanity test to double confirm if the correct version is installed, and if the software stack can get correct hardware information onboard your system. The command should return PyTorch* and Intel® Extension for PyTorch* versions installed, as well as GPU card(s) information detected.
# Pull the image and run a simple test to check if the Intel Extension for PyTorch is working correctly
docker pull intel/intel-extension-for-pytorch:2.7.10-xpu
# Run the test in the container while giving it access to the GPU devices
docker run --rm -it --device /dev/dri intel/intel-extension-for-pytorch:2.7.10-xpu \
  python -c "import torch; import intel_extension_for_pytorch as ipex; print(torch.__version__); print(ipex.__version__); [print(f'[{i}]: {torch.xpu.get_device_properties(i)}') for i in range(torch.xpu.device_count())];"

[W817 18:49:52.781169416 OperatorEntry.cpp:154] Warning: Warning only once for all operators,  other operators may also be overridden.
  Overriding a previously registered kernel for the same operator and the same dispatch key
  operator: aten::geometric_(Tensor(a!) self, float p, *, Generator? generator=None) -> Tensor(a!)
    registered at /pytorch/build/aten/src/ATen/RegisterSchema.cpp:6
  dispatch key: XPU
  previous kernel: registered at /pytorch/aten/src/ATen/VmapModeRegistrations.cpp:37
       new kernel: registered at /build/intel-pytorch-extension/build/Release/csrc/gpu/csrc/gpu/xpu/ATen/RegisterXPU_0.cpp:186 (function operator())
2.7.0+xpu
2.7.10+xpu
[0]: _XpuDeviceProperties(name='Intel(R) Arc(TM) A770 Graphics', platform_name='Intel(R) oneAPI Unified Runtime over Level-Zero', type='gpu', driver_version='1.6.32567+18', total_memory=15473MB, max_compute_units=512, gpu_eu_count=512, gpu_subslice_count=32, max_work_group_size=1024, max_num_sub_groups=128, sub_group_sizes=[8 16 32], has_fp16=1, has_fp64=0, has_atomic64=1)
[1]: _XpuDeviceProperties(name='Intel(R) Arc(TM) A770 Graphics', platform_name='Intel(R) oneAPI Unified Runtime over Level-Zero', type='gpu', driver_version='1.6.32567+18', total_memory=15473MB, max_compute_units=512, gpu_eu_count=512, gpu_subslice_count=32, max_work_group_size=1024, max_num_sub_groups=128, sub_group_sizes=[8 16 32], has_fp16=1, has_fp64=0, has_atomic64=1)
Output should look like this, with the GPU name and properties printed. Congrats, you can be sure that the Intel Extension for PyTorch is working correctly and can access the GPU devices, otherwise you’ll receive something of the likes of XPU device not found or similar.
05 TLS: a local CA for now Link to heading
I didn’t want public ACME in the lab. I minted a self‑signed root inside the cluster and used a CA ClusterIssuer for leaf certs. Trust is me installing the root CA on my devices, for the flex of having https on my ingress
Manifests were deployed at boostrapping the cluster: bootstrap/infra/cert-manager/kustomization/root-ca.yaml.
06 Secrets: SOPS, encrypted in Git Link to heading
I keep secrets in the repo but encrypted with SOPS (age). Flux decrypts at apply time, so I get Git history without leaking credentials. Policy lives at the root: .sops.yaml. I encrypt per‑app secrets next to the app manifests. In a helm context, Flux uses its secret generator to decrypt the secrets and pass them to the helm release.
Keys are off‑repo. The cluster only knows the age private key needed by Flux to decrypt.
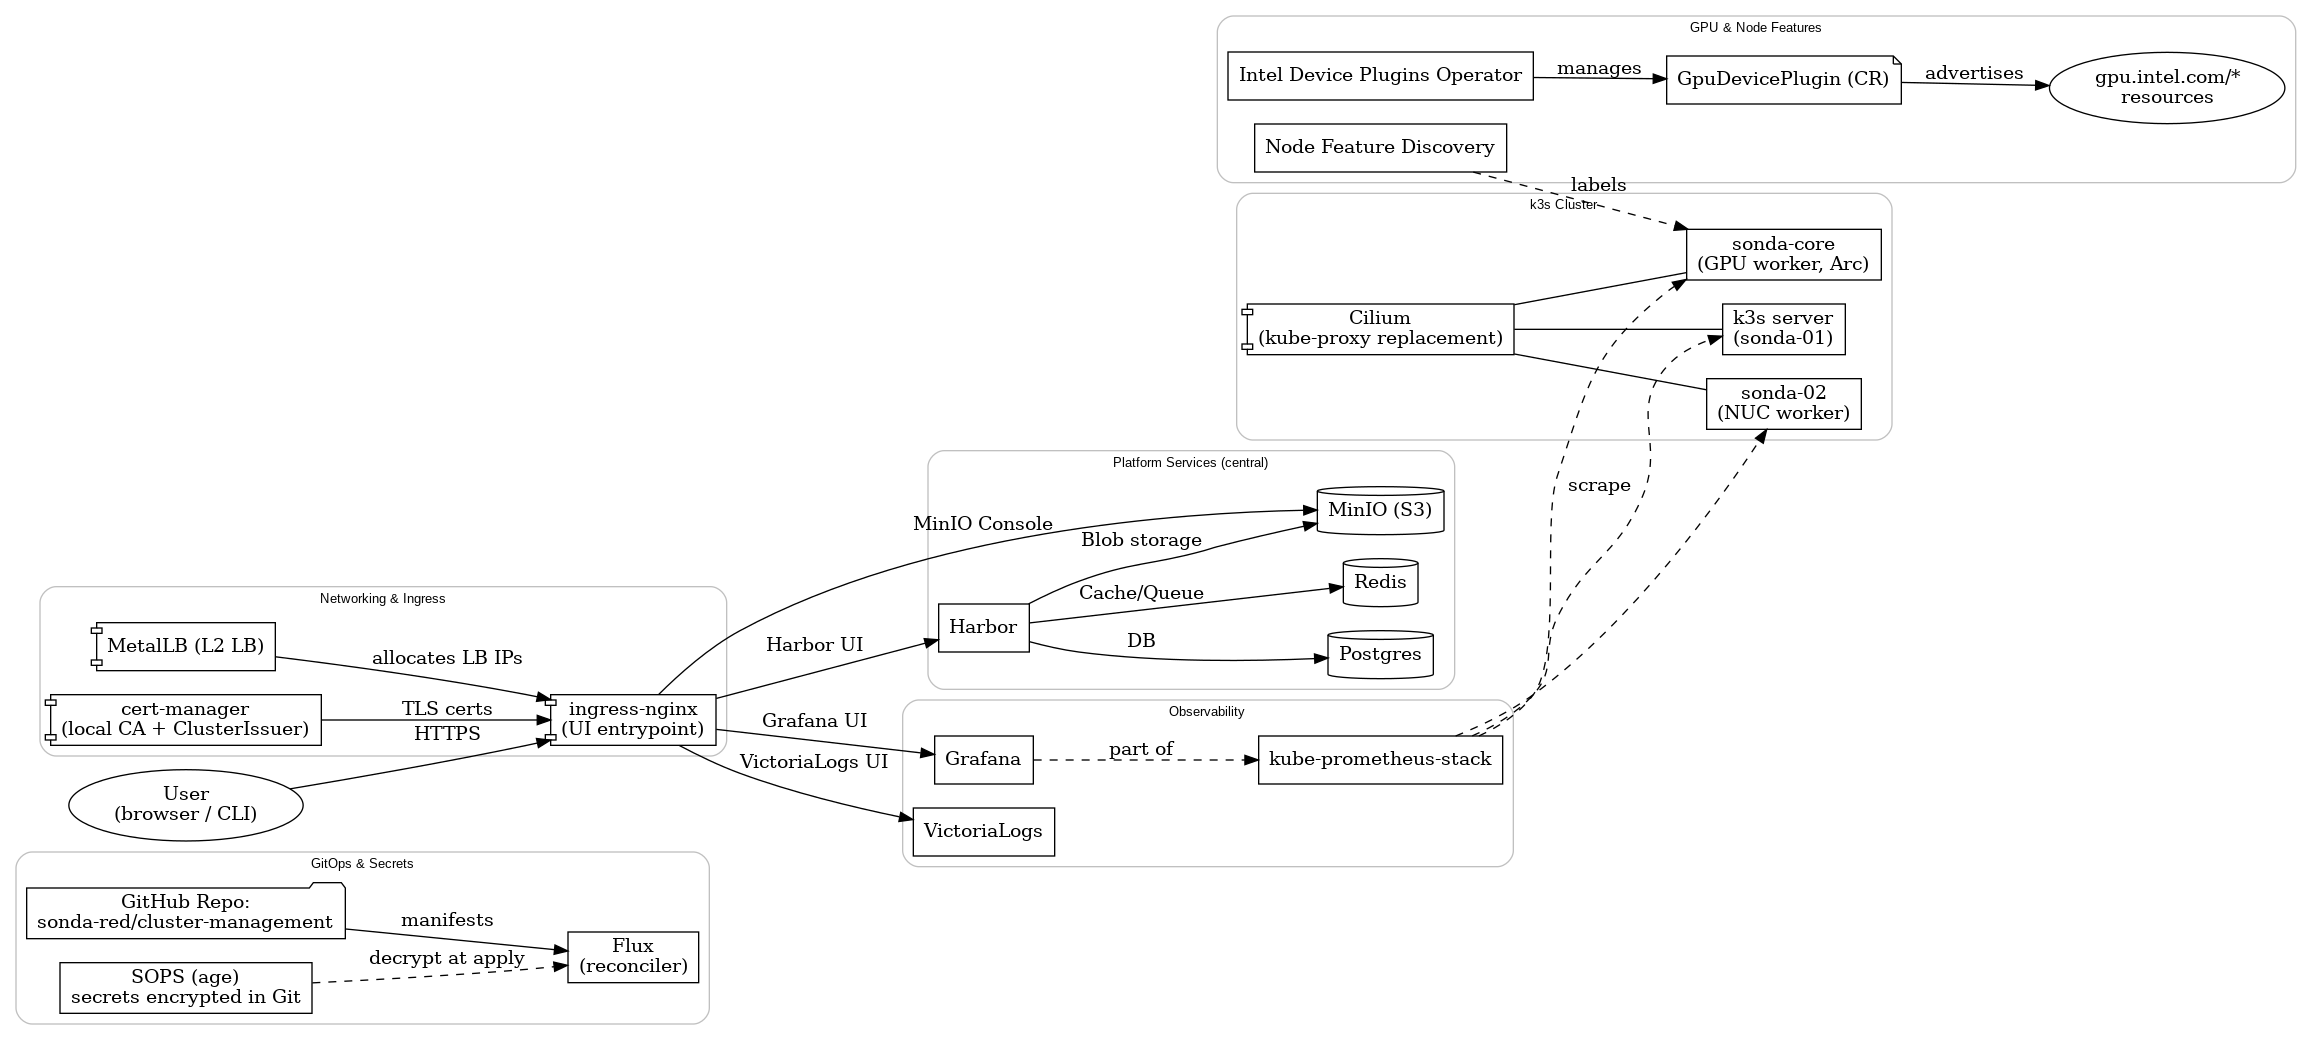
07 Architecture diagram Link to heading
Below is the map I keep in my head. Central services (Postgres, Redis, MinIO) are shared by design; Harbor is just the first consumer but each later component requiring them will connect to them and not run its separate service. Ingress mainly fronts internal UIs — Harbor, MinIO Console, Grafana, and VictoriaLogs.
08 Component overview Link to heading
Entry path for the reconciler: clusters/sonda-red/ Reusable bits for Helm releases: templates/flux/helm-release/
More or less self-explanatory infrastructure components: Link to heading
- Object storage: MinIO → infrastructure/minio/
- Registry: Harbor (on Postgres + Redis) → infrastructure/harbor/
- Datastores: Postgres → infrastructure/postgresql/, Redis → infrastructure/redis/
- Ingress: ingress‑nginx → bootstrap/infra/ingress-nginx/
- LB: MetalLB → infrastructure/metallb/
- Metrics & dashboards: kube‑prometheus‑stack → infrastructure/monitoring/kube-prometheus-stack/
- Logs: VictoriaLogs → infrastructure/monitoring/victorialogs/
- CI runners: Actions Runner Controller → infrastructure/arc/
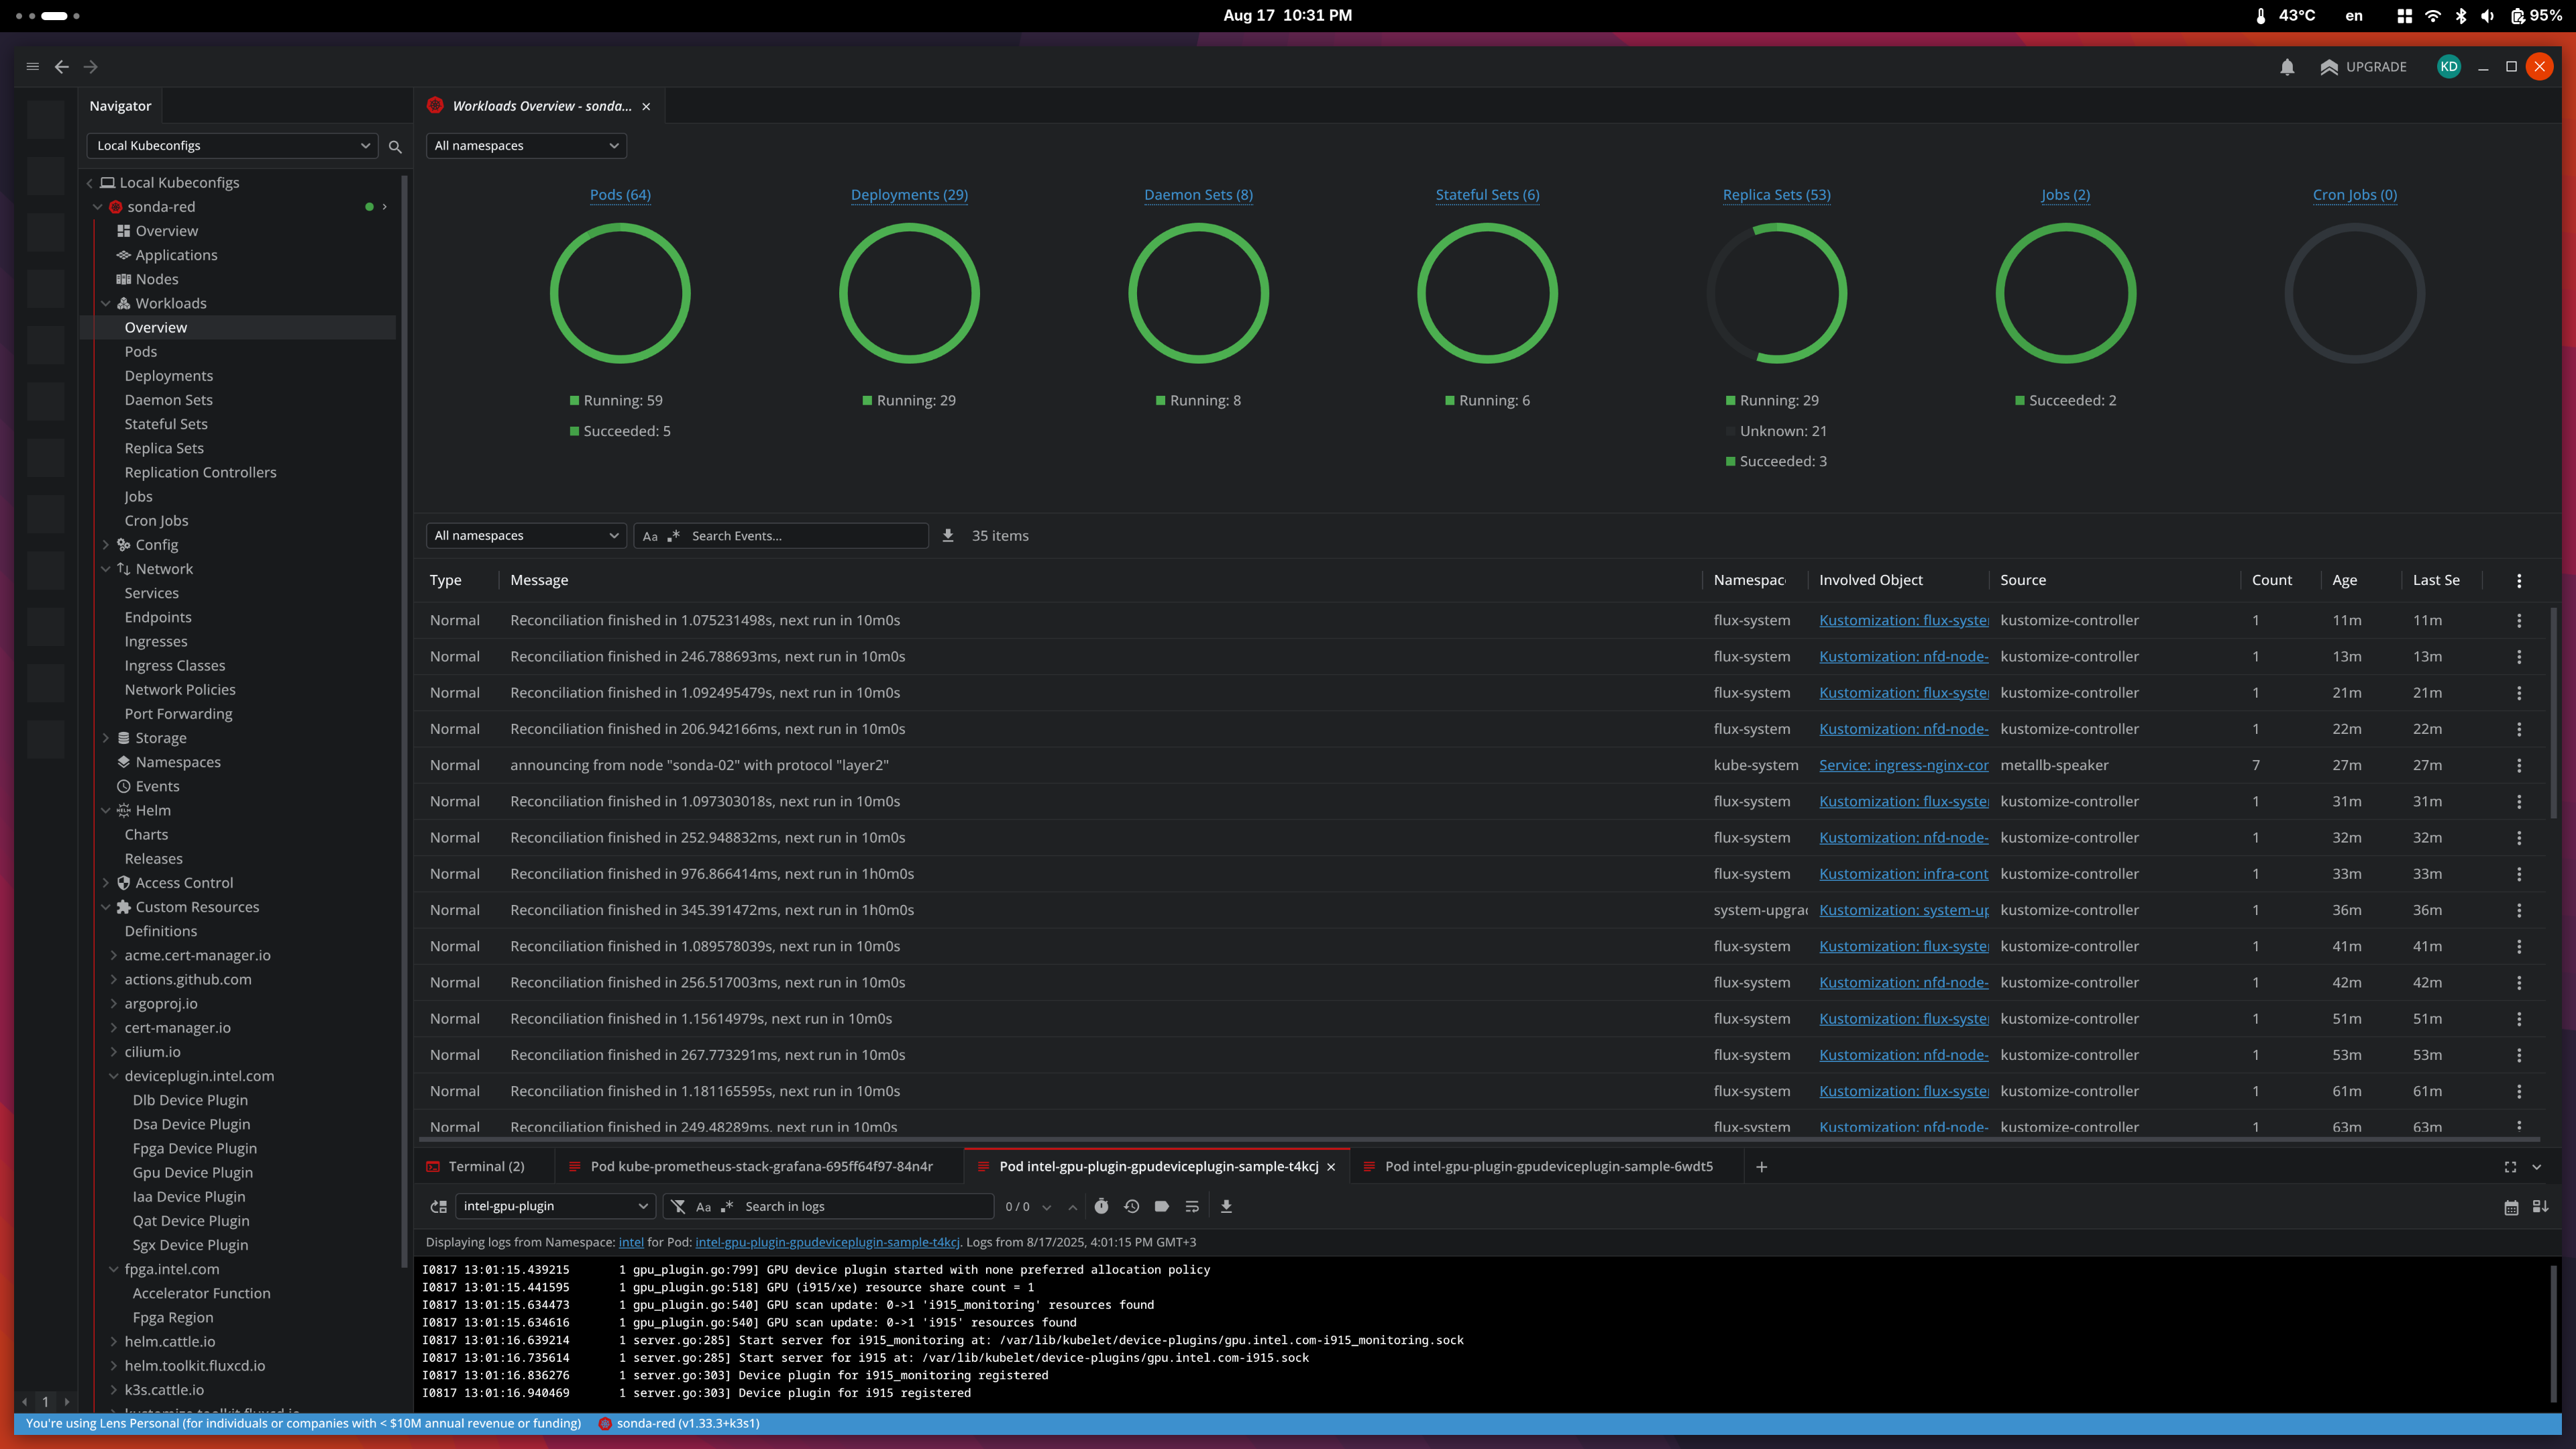
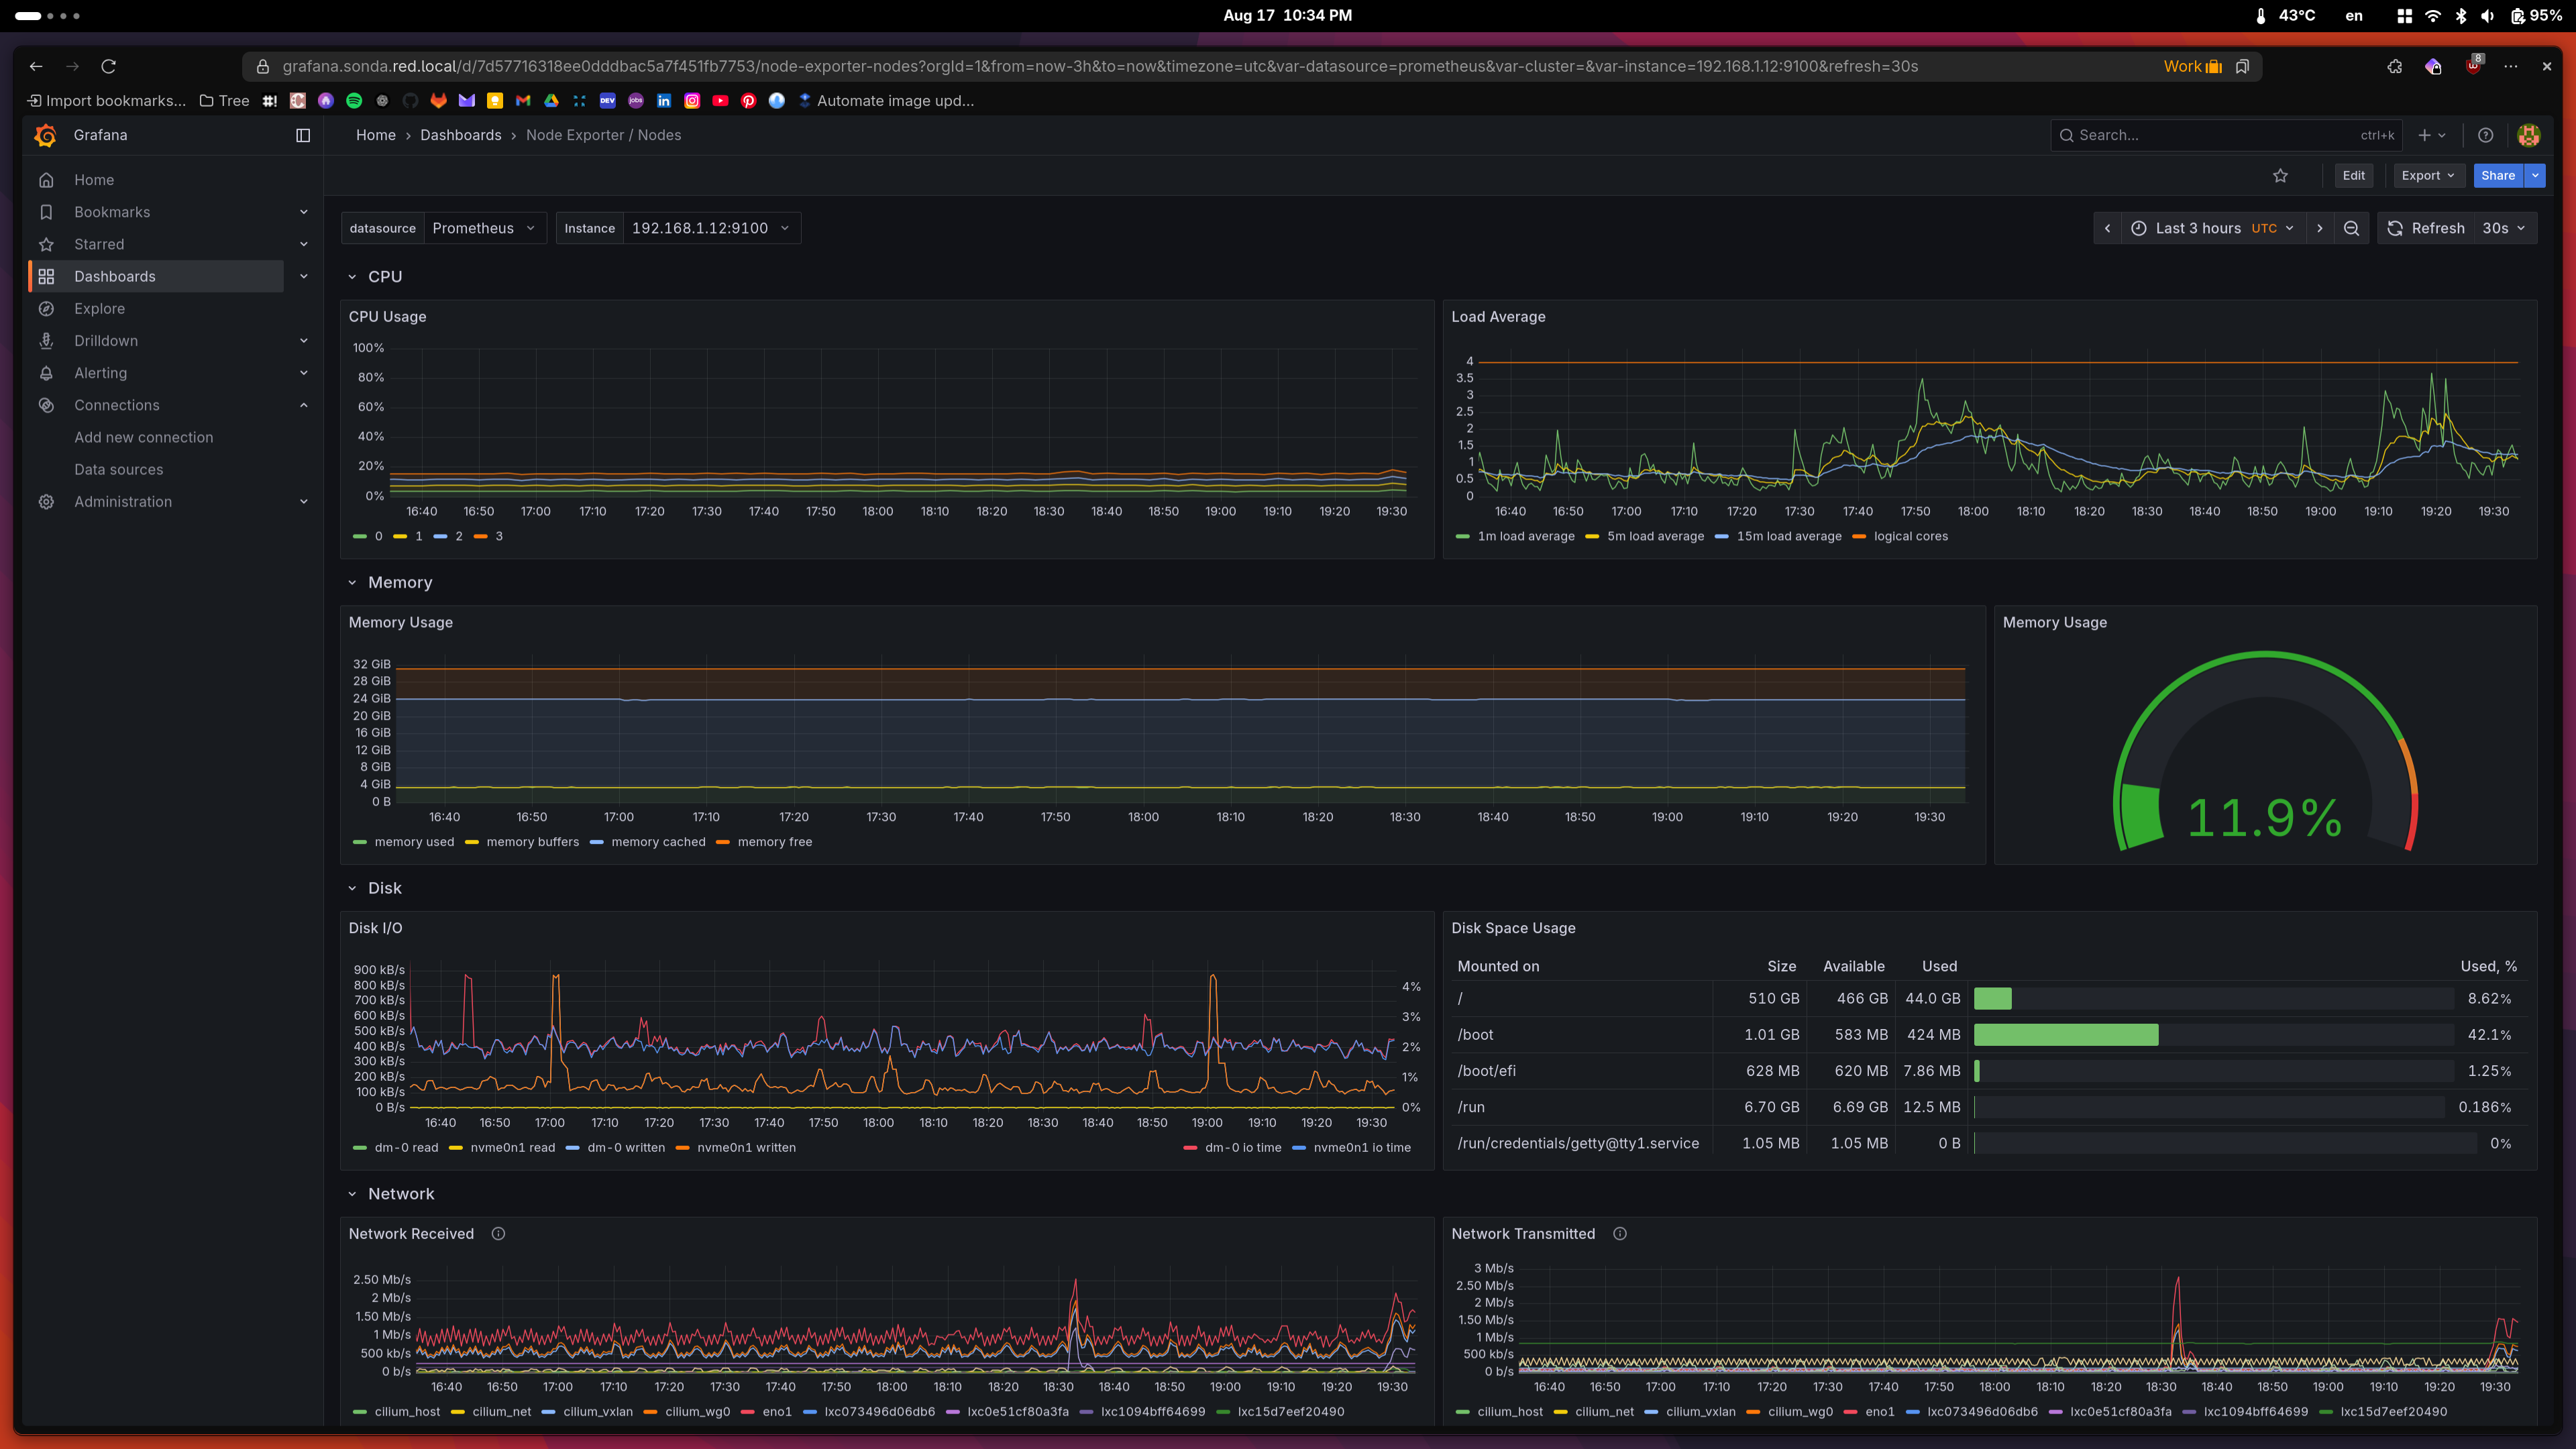
A note on observability:
My stack is intentionally simple. Full observability is a bit out of my scope, especially setting up alerting, etc. I have the basics down, as well as the default dashboards in Grafana, but I mainly stay in Lens to follow logs or deployment status while I’m working on the cluster.
| Lens Workload Overview | Master Node Status View |
|---|---|
 |
 |
Central services Link to heading
I chose central Postgres, central Redis, and central MinIO as cluster services. Today only Harbor consumes them, but they’re for the whole cluster. That keeps state small in number of places and easy to back up. MinIO takes the largest chunk of storage from the 2 TB NVMe, as it’s intended to be the S3 backend for most apps and I’ll try to avoid persistent volumes when I can.
Harbor points to the shared services explicitly (values excerpt):
# harbor values
+ externalURL: https://harbor.sonda.red.local
+ database:
+   type: external
+   external:
+     host: postgres.postgres
+     username: harbor
+     coreDatabase: harbor
+ redis:
+   type: external
+   external:
+     addr: redis.redis:6379
Full manifests sit under infrastructure/harbor/.
k3s specifics Link to heading
- Upgrades: System Upgrade Controller → flux-system/system-upgrade-controller.yaml
k3s has a system-upgrade-controller, which is not built in but separately installed. It consists of an operator and a controller that watches for Plan resources and applies them to the nodes. The nodes are adequately drained, cordoned and upgraded. I use it to upgrade the k3s version from within the cluster, so I can just change the version in the Plan and it will apply it to all nodes, without having to run k3s scripts on the nodes manually.
An upgrade Plan looks like this:
# Server plan
apiVersion: upgrade.cattle.io/v1
kind: Plan
metadata:
  name: server-plan
  namespace: system-upgrade
spec:
  concurrency: 1
  cordon: true
  nodeSelector:
    matchExpressions:
    - key: node-role.kubernetes.io/control-plane
      operator: In
      values:
      - "true"
  serviceAccountName: system-upgrade
  upgrade:
    image: rancher/k3s-upgrade
  version: v1.33.3-k3s1
  tolerations:
    - key: node-role.kubernetes.io/master
      operator: Exists
      effect: NoSchedule
    - key: node.kubernetes.io/unschedulable
      operator: Exists
      effect: NoSchedule
---
# Agent plan
apiVersion: upgrade.cattle.io/v1
kind: Plan
metadata:
  name: agent-plan
  namespace: system-upgrade
spec:
  concurrency: 1
  cordon: true
  nodeSelector:
    matchExpressions:
    - key: node-role.kubernetes.io/control-plane
      operator: DoesNotExist
  prepare:
    args:
    - prepare
    - server-plan
    image: rancher/k3s-upgrade
  serviceAccountName: system-upgrade
  upgrade:
    image: rancher/k3s-upgrade
  version: v1.33.3-k3s1
  tolerations:
    - key: dedicated
      operator: Equal
      value: gpu
      effect: PreferNoSchedule
    - key: node.kubernetes.io/unschedulable
      operator: Exists
      effect: NoSchedule
Intel GPU specifics Link to heading
- Node inventory: Node Feature Discovery → infrastructure/nfd/ It detects the presence of Intel GPUs and labels them accordingly. GPU plugin’s node selector is used to deploy plugin to nodes which have such a GPU label.
- Intel Device Operator: Intel Device Operator → infrastructure/intel-device-operator/ Intel Device Plugins Operator is a Kubernetes custom controller whose goal is to serve the installation and lifecycle management of Intel device plugins for Kubernetes. It provides a single point of control for GPU, QAT, SGX, FPGA, DSA and DLB devices to cluster administrators.
- Intel GPU plugin: Intel Device Plugin → infrastructure/intel-device-plugins-gpu/
As taken from the official docs: https://intel.github.io/intel-device-plugins-for-kubernetes/cmd/gpu_plugin/README.html
Intel GPU plugin facilitates Kubernetes workload offloading by providing access to discrete (including Intel® Data Center GPU Flex & Max Series) and integrated Intel GPU devices supported by the host kernel.
Use cases include, but are not limited to:
Media transcode
Media analytics
Cloud gaming
High performance computing
AI training and inference
Basically, it exposes the Intel GPUs to the cluster as resources, so you can request them in your pods. As soon as you install the plugin, the DaemonSet is created and the GPUs are advertised to the scheduler. A pod also spawns on each node that has the appropriate label, which prints:
I0817 13:01:11.792873       1 gpu_plugin.go:799] GPU device plugin started with none preferred allocation policy
I0817 13:01:11.793010       1 gpu_plugin.go:518] GPU (i915/xe) resource share count = 1
I0817 13:01:11.793909       1 gpu_plugin.go:540] GPU scan update: 0->2 'i915' resources found
I0817 13:01:11.793915       1 gpu_plugin.go:540] GPU scan update: 0->1 'i915_monitoring' resources found
I0817 13:01:12.794849       1 server.go:285] Start server for i915_monitoring at: /var/lib/kubelet/device-plugins/gpu.intel.com-i915_monitoring.sock
I0817 13:01:12.794851       1 server.go:285] Start server for i915 at: /var/lib/kubelet/device-plugins/gpu.intel.com-i915.sock
I0817 13:01:12.797391       1 server.go:303] Device plugin for i915 registered
I0817 13:01:12.797394       1 server.go:303] Device plugin for i915_monitoring registered
I0817 13:01:13.629689       1 gpu_plugin.go:92] Select nonePolicy for GPU device allocation
I0817 13:01:13.629703       1 gpu_plugin.go:138] Allocate deviceIds: ["card0-0"]
This log shows the Intel GPU plugin found the two Arc GPUs, registered them with the kubelet, and now pods can request them by adding resources.requests: { gpu.intel.com/i915: 1 }. The monitoring resource is also available if you deploy the sidecar/telemetry components.
Component updates Link to heading
Wired Renovate so chart bumps show up as PRs I can merge (or ignore): renovate.json
09 To-do and next steps Link to heading
- Add bootstrap helmfile deployments to be managed by Flux
- Research and add Flux dashboards as quality of life improvement
- Begin building some containers with the
arcrunners and push them to Harbor - VPN or some kind of public endpoint for remote access to the cluster
Hopefully, this is where the fun begins. I want to experiment a bit with scheduling and running different kinds of workloads. No real solid plan for the next article but I have a few ideas:
- Stable Diffusion
- LLMs and different inference engines like vllm, llama.cpp, etc.
- Explore model and prompt versioning
- Observability of Intel GPUs and their utilization
- Benchmarking and comparing different inference engines?
- Loading bigger models on both GPUs